
BACK TO ARTICLES
Identifying the Right Key Opinion Leaders in Pharma Using Machine Learning: Creating a Data - Driven Process for Impactful Outcomes
Written By - Nikhil Jain, Partner

Key Opinion Leaders (KOLs) are experts who provide valuable insights into the unmet needs and preferences of the target patient market as well as have an influential impact on the decision-making process of other healthcare professionals. They are often involved in clinical trials, research publications, educational outreach, thought leadership, guideline development, and policy-making initiatives. KOLs offer immediate and actionable insight that can significantly impact brand awareness and inform strategic campaign planning. Thus, identifying KOLs is crucial for pharmaceutical and biotechnology companies, as the KOLs can provide valuable insights that these companies can leverage to design and execute effective business strategies across R&D and commercial. However, identifying KOLs is not a straightforward task, as it requires collecting and analyzing data from multiple sources such as clinical trials, research papers, media articles, patient claims, and other healthcare databases. Therefore, a comprehensive and systematic approach is needed to integrate and process the data from various sources and identify the KOLs that match the specific business objectives and criteria. In this paper, we propose a methodological and standardized approach to identify KOLs in any therapeutic area using machine learning algorithms leveraging data from various sources. We have described the main steps and challenges involved in the process, as well as the possible approaches that can be followed to achieve the desired business outcomes.
Keywords:
Machine Learning, Key Opinion Leader, KOL, Real-World data, Feature Engineering, Digital Opinion Leader.1. Background
1.1 Importance of KOLs:
KOLs are subject matter experts who are integral in driving medical breakthroughs. They create awareness about a drug’s Mechanism of Action and lend credibility to products in the healthcare community. They have a wealth of knowledge in their respective fields due to extensive experience in managing diverse patient cases, adept at diagnosing multiple diseases, contributing to key medical research, and thus, holding significant influence over their peers and patients. They act as a strong bridge connecting patient needs with medical R&D efforts. Thus, pharma companies are always keen to engage with KOLs to position their drug(s) in the market through proven drug characteristics like newer and effective therapies, better efficacy, fewer side effects, ease of use, etc. which can lead to better adoption and positive 6 patient outcomes. By extension, this also helps pharma companies commercially in driving up sales and revenue. For example, as per published data in industry articles1 , companies that had MSLs engage with KOLs before product launch to educate them about the latest healthcare developments, had 1.5 times greater treatment adoption across the opinion leaders’ healthcare organizations in the first six months of product launch.
1.2 Challenges with the existing approaches:
i. Lack of a data-driven technique:
Currently, there is an over-reliance on internal teams across medical, sales, marketing, etc. to gather inputs on opinion leaders in the target market with limited usage of various available data points. ii. Lack of standardization across diverse sources:
With the increase in number of data sources related to research, drug development, social and general media, etc., collating information is a significant challenge and requires: a. Mapping data from different sources to a single HCP using de-anonymization techniques and
b. Filtering through the noise to find the relevant data.
iii. Lack of robust approach to quantify opinion leaders’ impact:
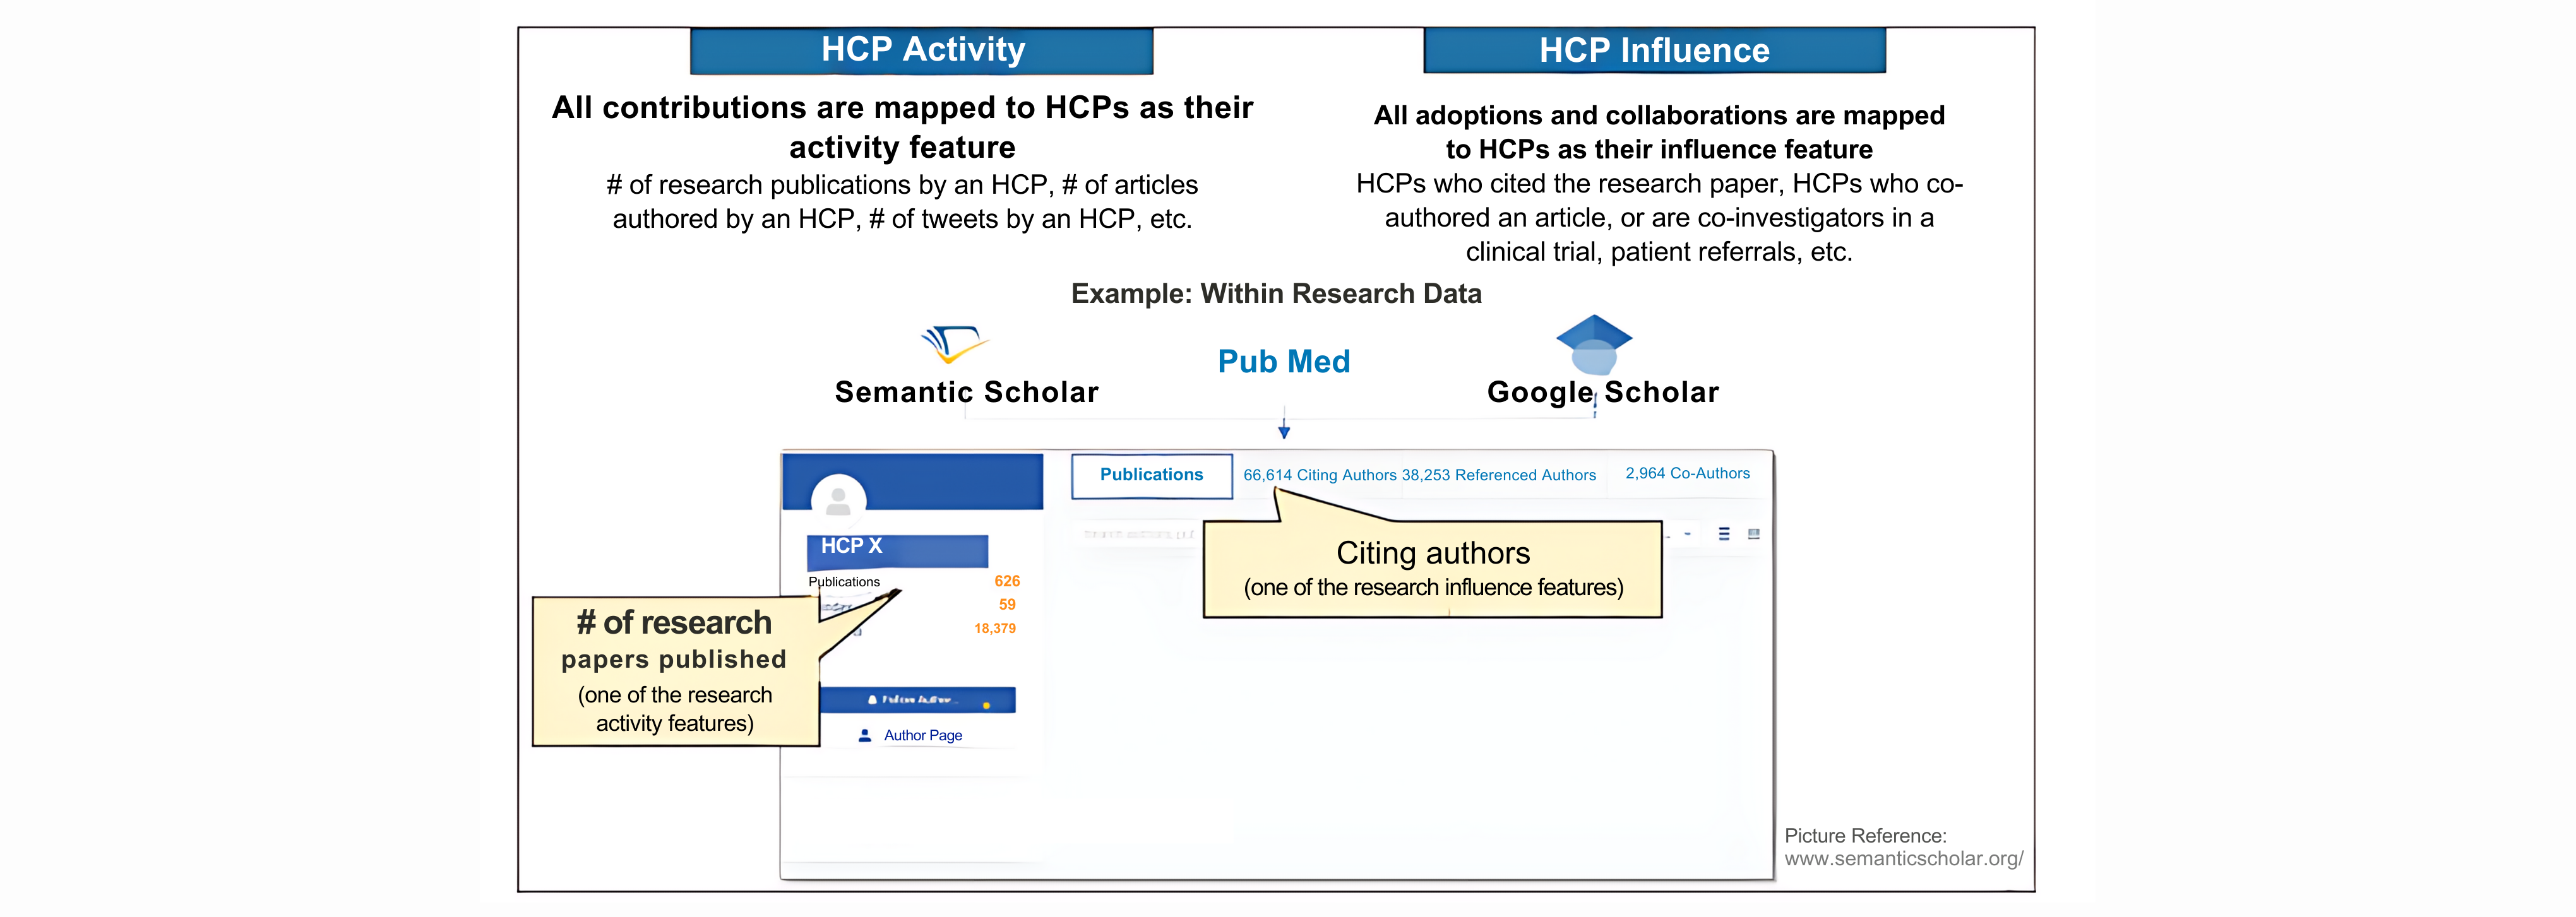
Once the required data is gathered, a standard approach needs to be deployed that can measure contributions and sphere of influence for each opinion leader in and across all data sources. Figure 1: We consider both HCP Activity and HCP Influence metrics for determining KOL status
2. Methodology
Our KOL identification approach is motivated by the fact that HCPs who have significant contributions as well as high influence in the healthcare community can be considered Key Opinion Leaders. These contributions could include research, publications, innovations, or any other activity that demonstrates expertise. Their level of influence is determined through the adoption of their work and collaborations with other HCPs, suggesting that their work is recognized and valued by their peers. This has been briefly summarized using an example in Figure 1.
All contributions are mapped to HCPs as their activity metric, and all adoptions as well as collaborations are mapped as their influence metric. These metrics are used for feature engineering of each data category to be input into the machine learning models.
3. Data Preparation
3.1 Identifying Data Categories & Sources:
KOLs are known for expressing their opinions, thought leadership, and research work through scientific publications, national/international conferences, various media sources, etc. They also actively participate in various clinical trials and hold executive positions in professional associations. Thus, identifying the right data categories and then gathering relevant data from the appropriate sources is an important prerequisite for our identification exercise. For our exercise, we have identified and gathered data from multiple sources for seven broad data categories (Table 1) as shown below: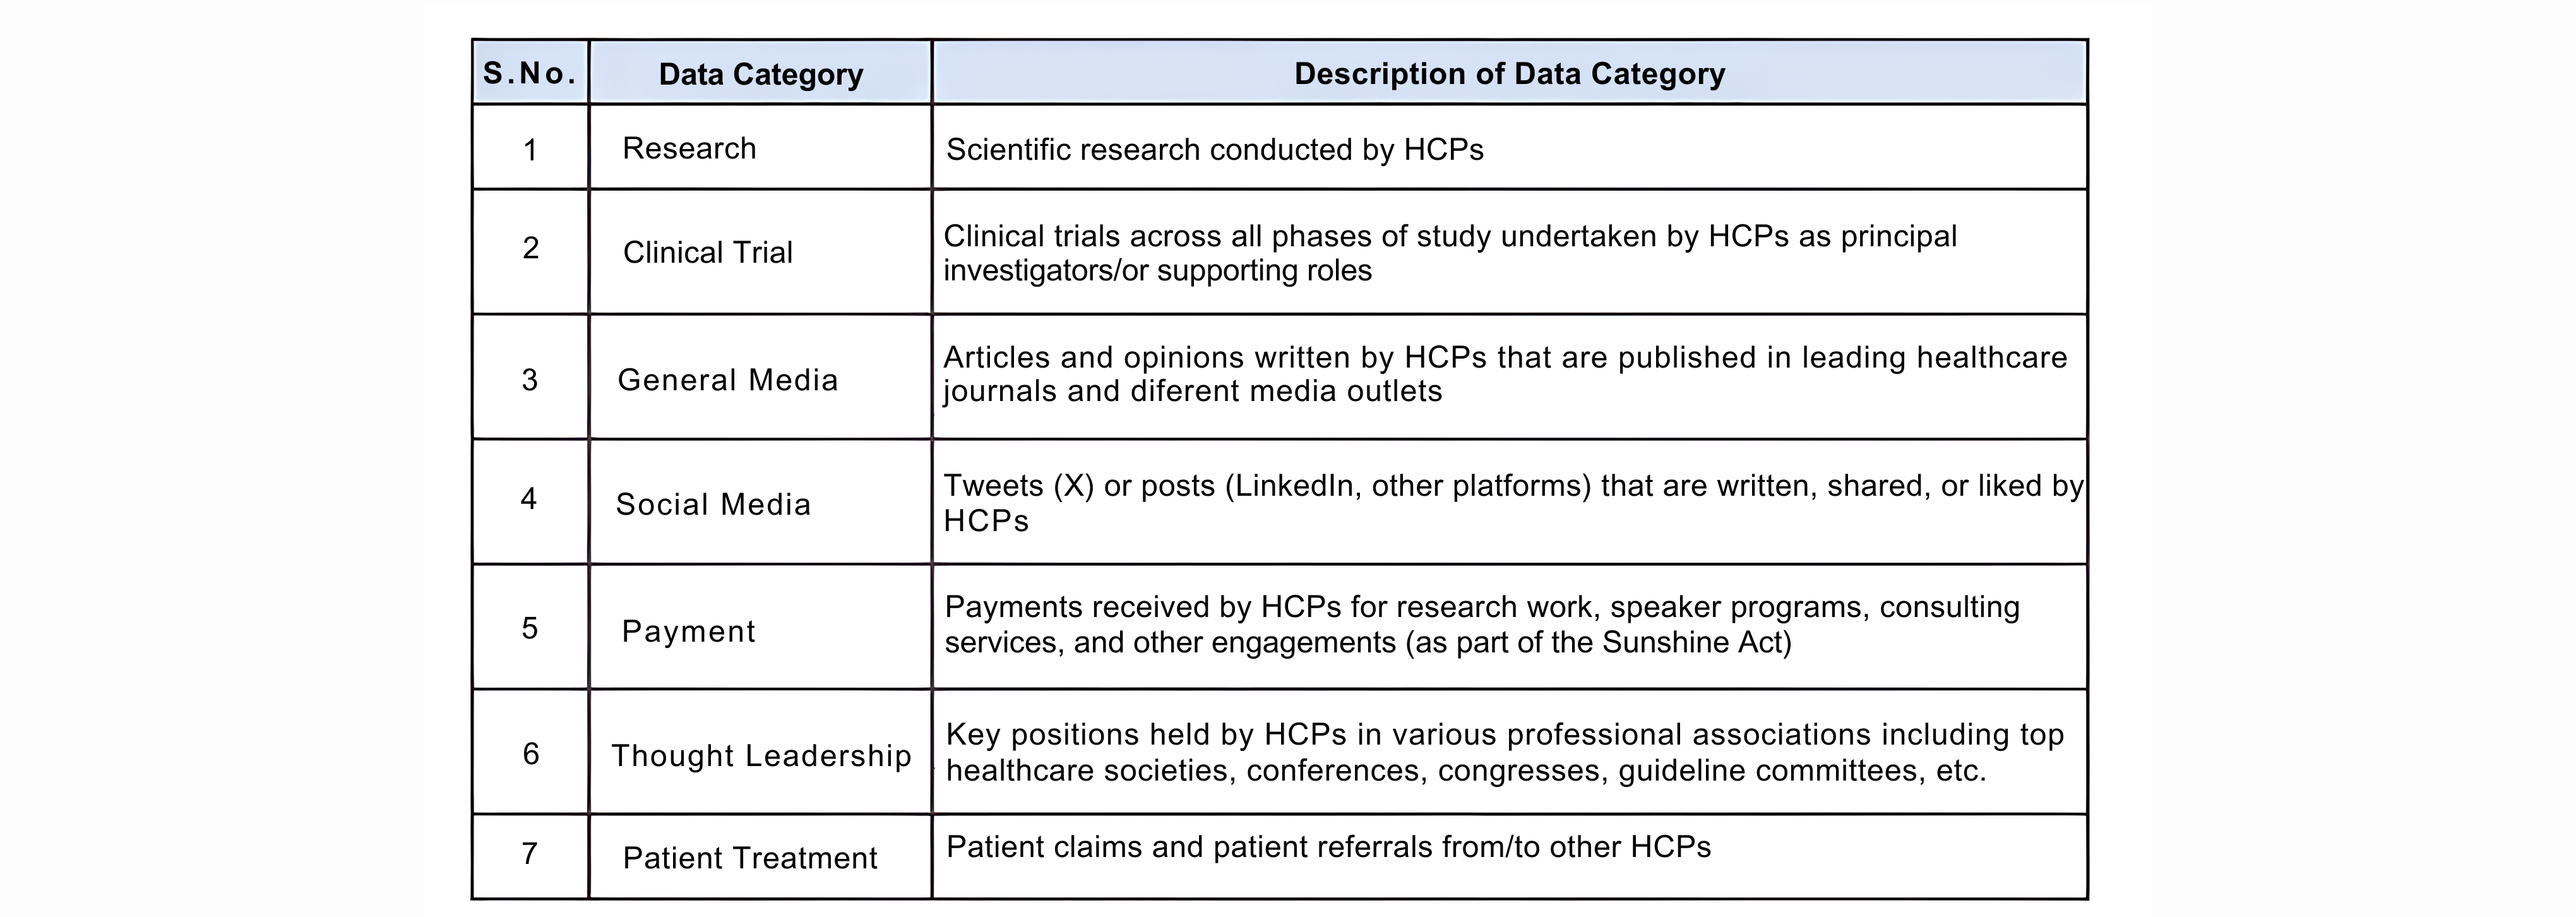
As we further conducted a deep dive into each data category to identify the source(s), we assessed their data on its Availability, Accessibility, and Stability i.e. selecting data repositories that provide:
i. Availability of comprehensive data coverage across HCPs
ii. Accessibility to relevant data fields for modeling
iii. Stability of data format through historical feeds
3.2 Mapping consolidated data to HCPs and indication:
One of the challenges with data gathering is that HCP(s) and Indication(s) might not be explicitly specified within a data source but embedded in accompanying textual information. Thus, a core process for the KOL identification exercise is to map each data information to relevant HCP(s) and Indication(s). Multiple machine learning algorithms are available to conduct this exercise.For example, to address indication mapping, we employed the BioBERT model, a specialized language representation model. Initially pre-trained on English Wikipedia and BooksCorpus, this model was further fine-tuned using biomedical corpora from PubMed and PMC, enabling effective mining of biomedical text.
3.3 Defining the HCP Cohort:
As the next step of data preparation, we filtered the data for the appropriate HCP cohort. A few of the selection criteria were: i. HCP Specialty: To understand the broader outlook on HCP’s specialization and medical interest.
ii. Activity Timeframe: To identify if the HCP(s) have been active in the last few years (e.g. to consider HCPs in the cohort if they have contributed across any data category in the last 2 years)
3.4 Data Preparation Summary:
We identified and gathered data from different relevant sources across each data category and applied HCP/indication mapping, and pre-processing steps to store mapped data of relevant HCP cohorts in a standard format. This was further utilized by the machine learning models to identify KOLs (Figure 2).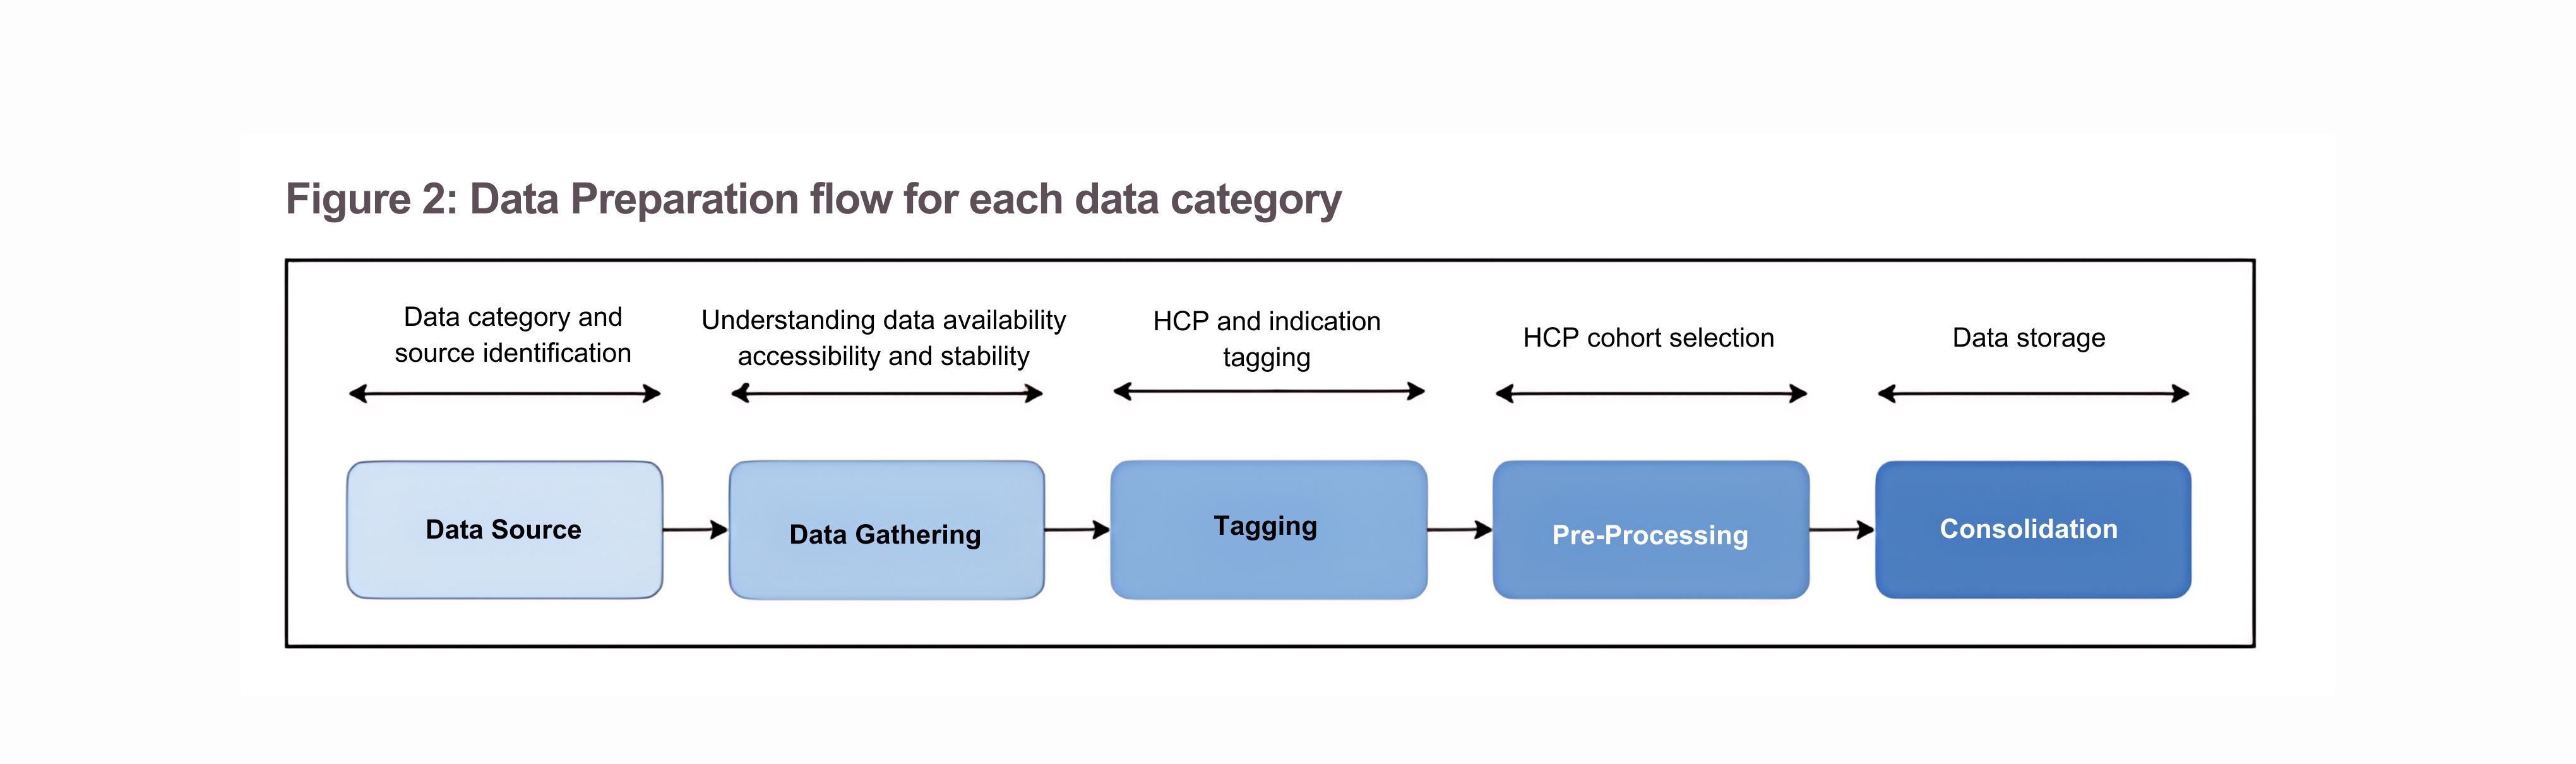
4. Machine Learning Modeling
4.1 Feature Engineering:
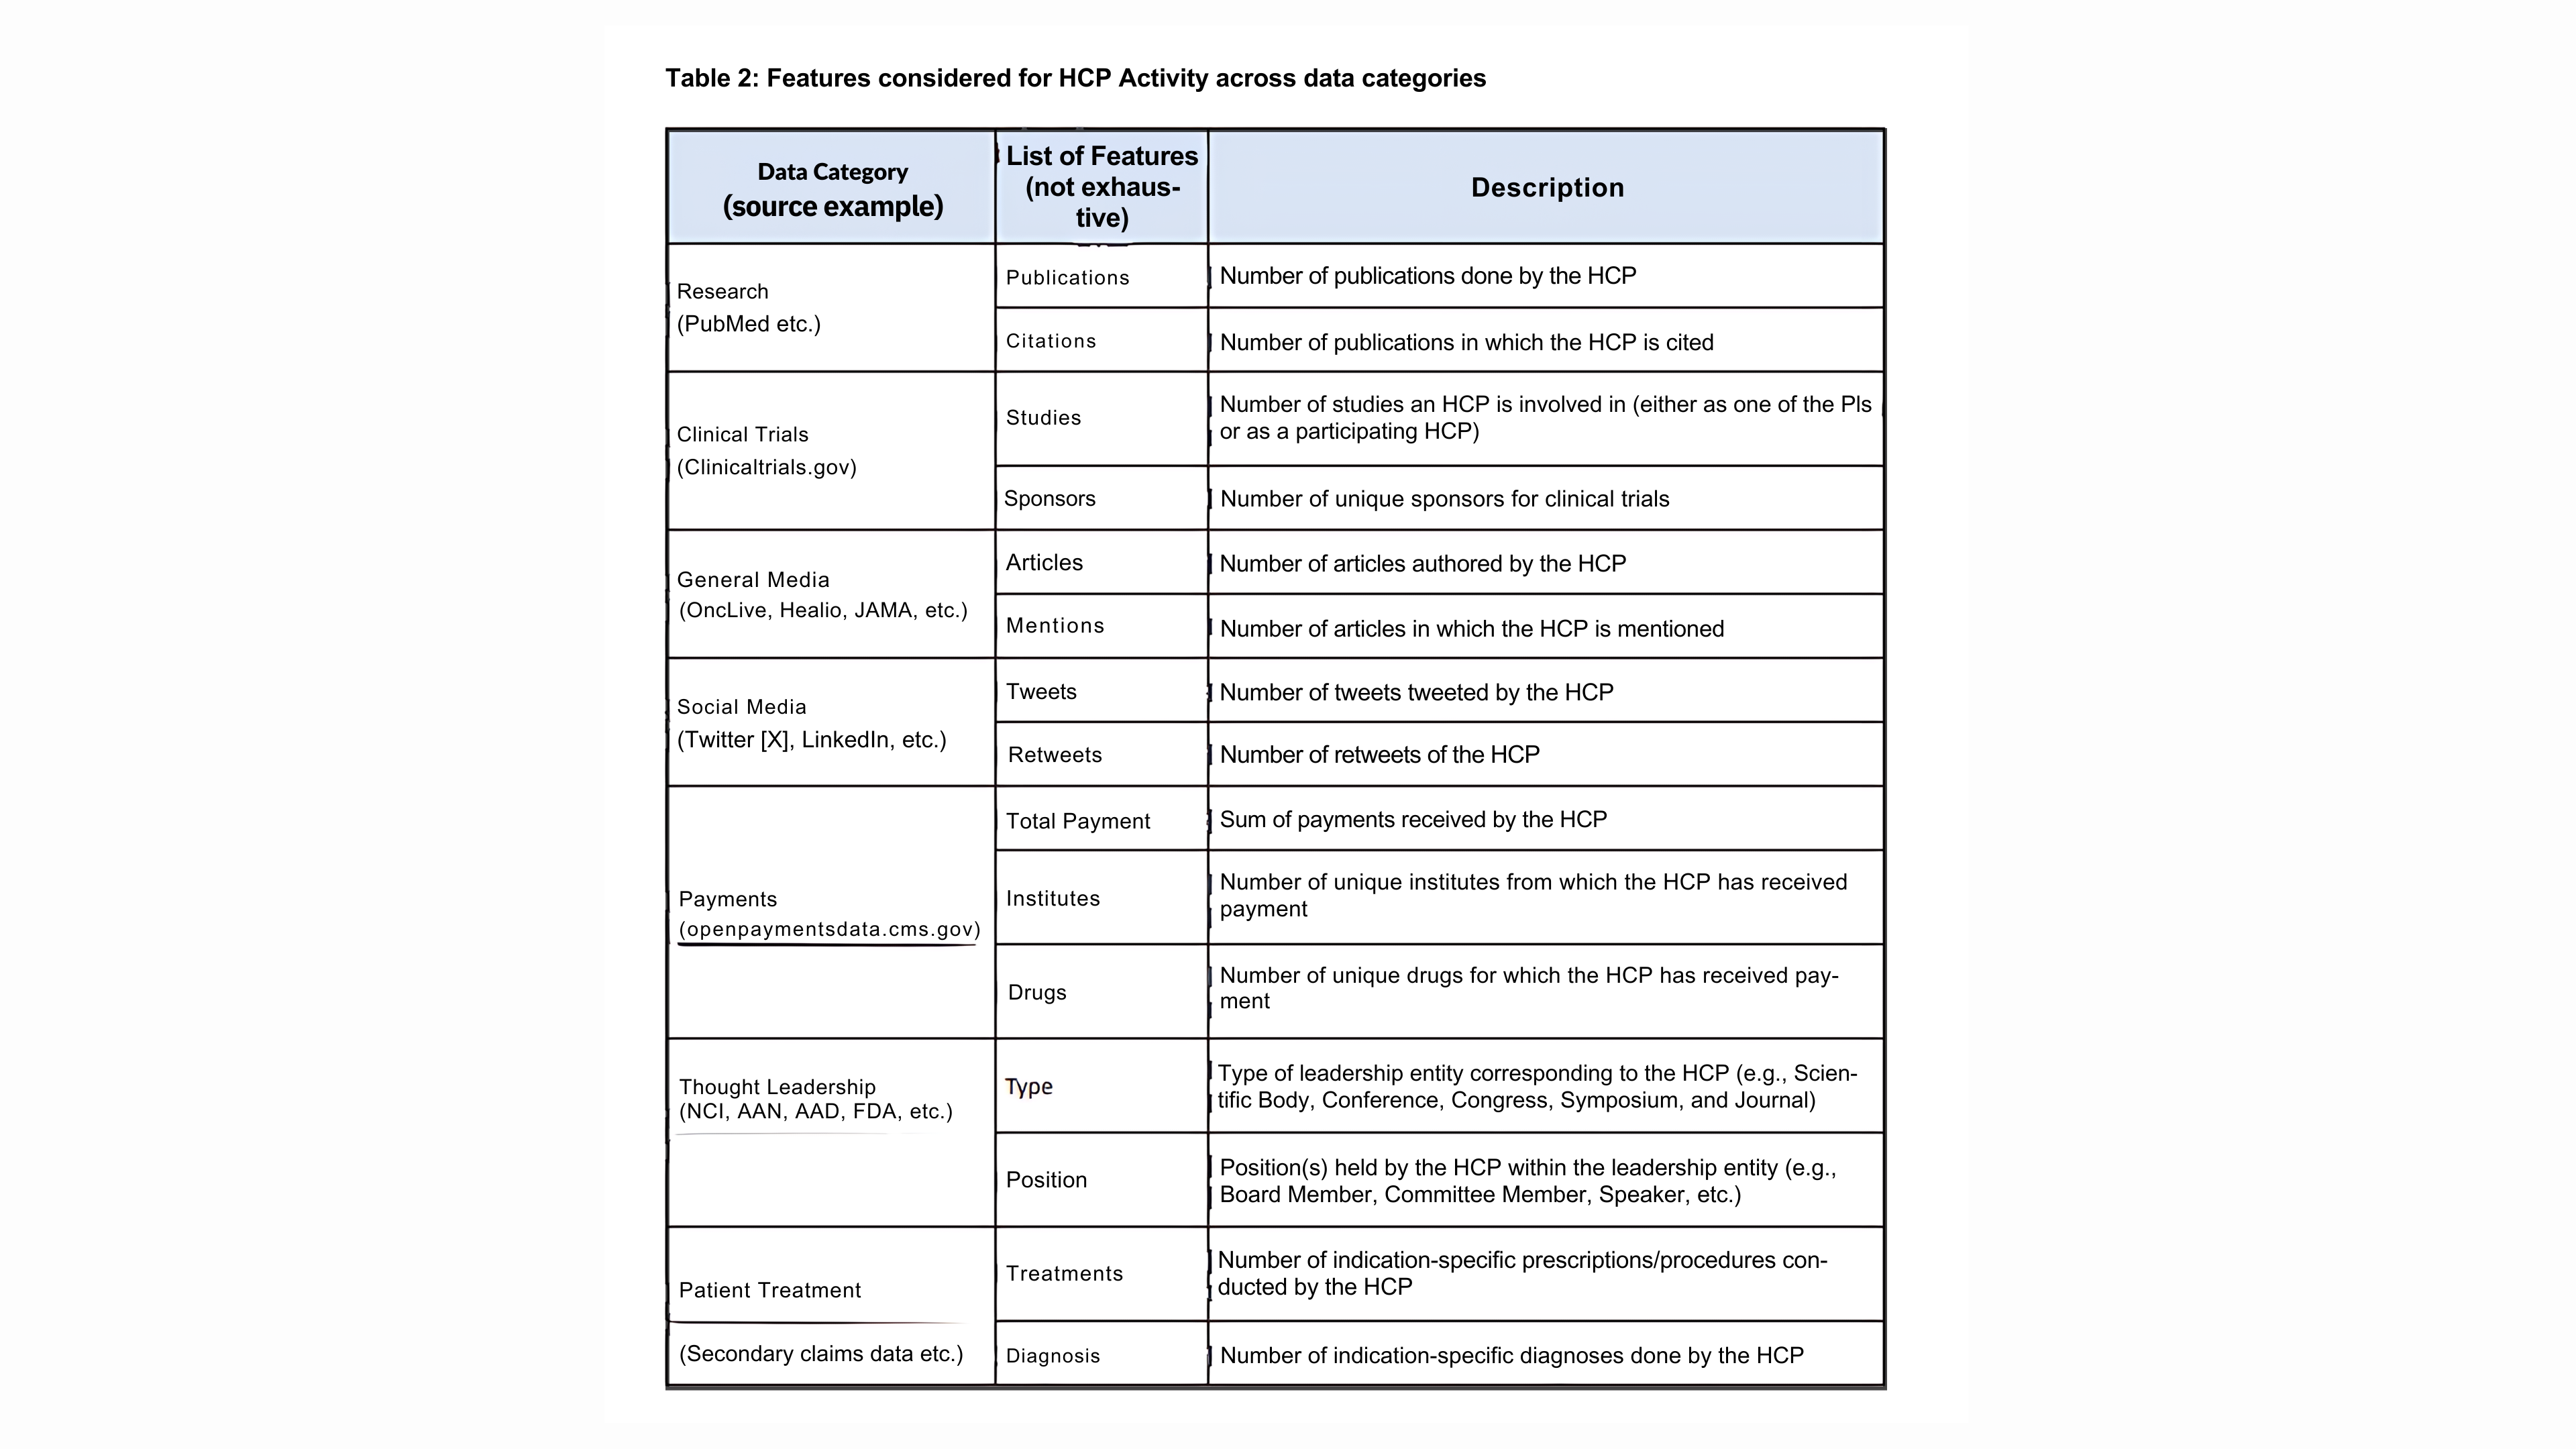
We looked at HCP Activity and Influence features for KOL identification.i. HCP Activity Features:
ii. HCP Influence Features:
To quantify HCP influence, we used network graph analysis within each data category. These help us understand: • Direct influence on associated HCPs
• Efficient exchange/flow of information between clusters of HCPs through these HCPs
Graphs are mathematical structures used to model many types of relationships and processes in information systems. They are primarily composed of:
• Nodes: which represent system entities (e.g. each HCP is a single node in our case)
• Edges: which represent relationship(s) between entities. (i.e. HCPs connectivity with other HCPs)
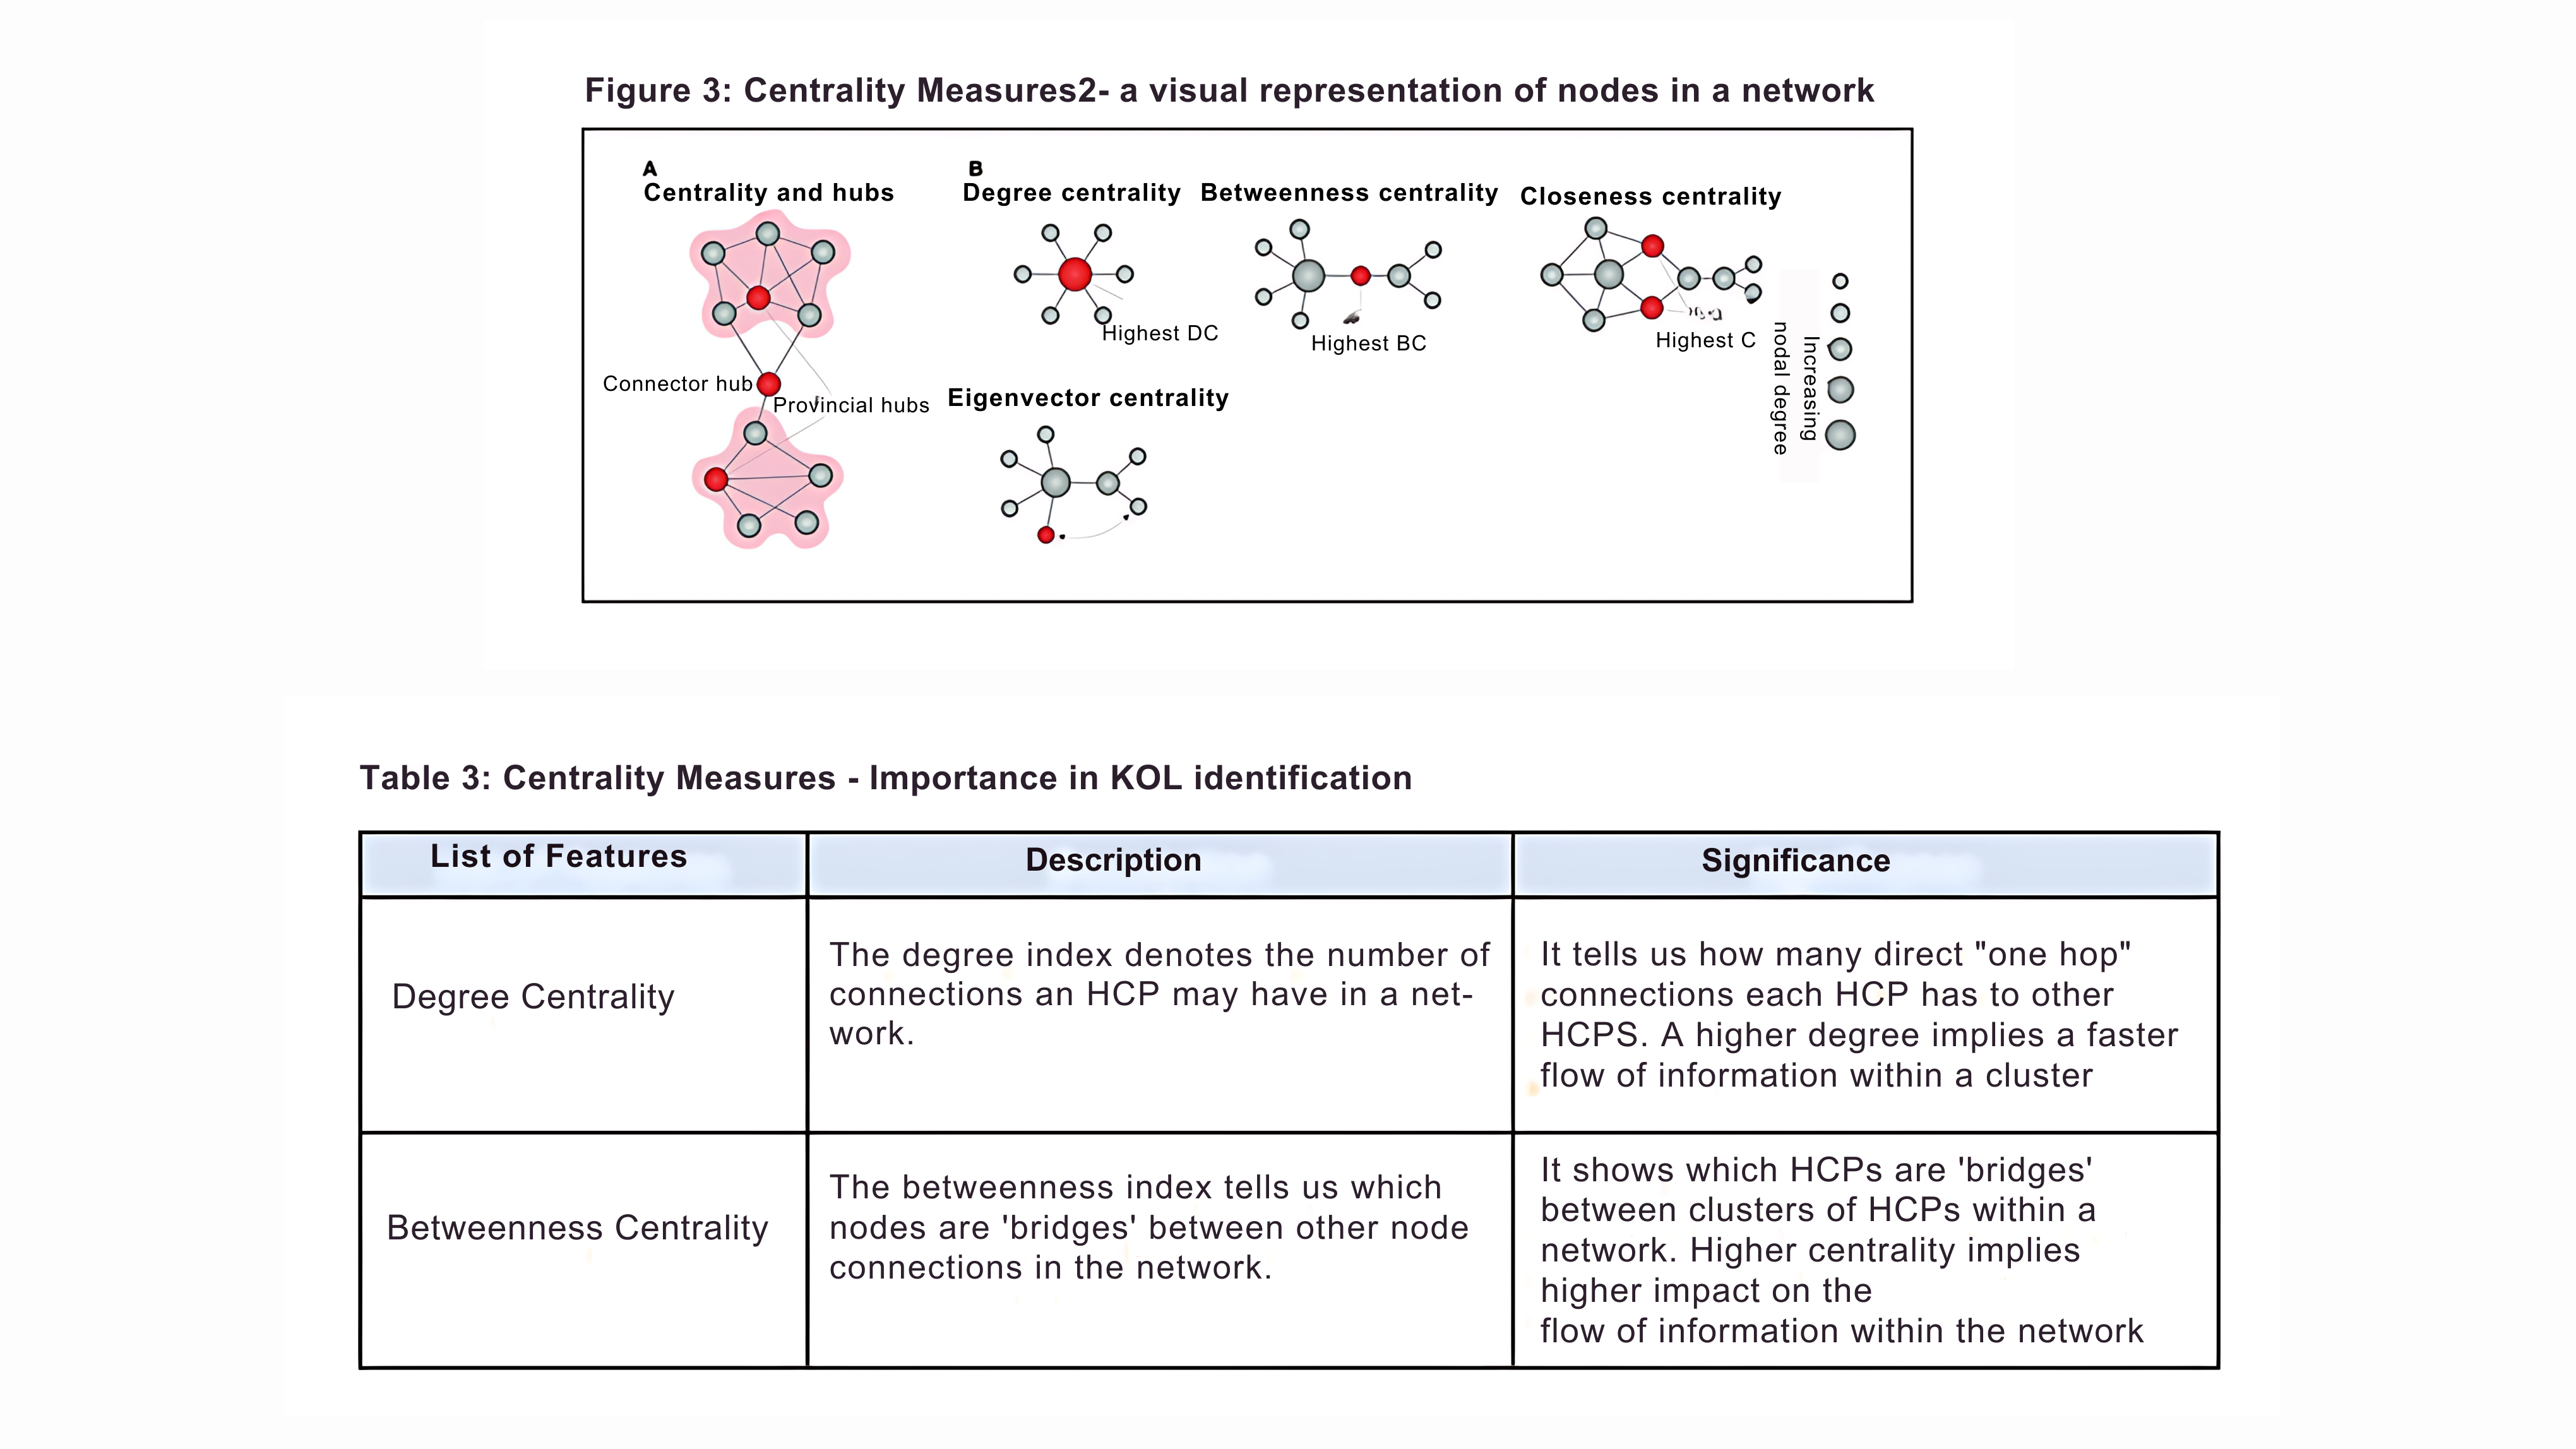
Specifically, to identify the important nodes in any graph, we use the concept of centrality. Centrality measures the degree to which a node is central to the network, i.e., it gives us an idea about the number of direct connections a node has or how many other nodes it serves as a link. There exist four centrality measures, each capturing different aspects of a node’s significance within a network. These are:
• Degree Centrality
• Betweenness Centrality
• Closeness Centrality
• Eigen Vector Centrality
In the context of our exercise, we selected and employed the following centrality measures to create influence features for each HCP within each data category: Degree Centrality and Betweenness Centrality (refer to Table 3 for their definition and significance)
iii. Normalization & Standardization:
After the features have been created for activity and influence, we converted these into ordinal scores with values ranging between 0 and 1. These scores are obtained by normalizing and standardizing the observations of the above features. These scores are then utilized by the Machine Learning model that is elaborated in the next section. [Normalizing: If denotes the observation of the feature, then the normalized observation would be where and denote the mean and standard deviation of the observations of the feature. Normalizing converts the distribution of observations to one with 0 mean and unit standard deviation. Standardizing: If denotes the observation of the feature, then the standardized observation would be where and denote the maximum and minimum observation corresponding to the feature. Note that standardized scores lie between 0 and 1.]
4.2 Machine Learning Models Overview:
As we worked with unlabeled data, we utilized unsupervised machine learning algorithms for our KOL identification exercise. The models were filtered which offered anomaly detection techniques since KOLs are HCPs who are outliers due to their significant contributions and influence compared to other HCPs within each data category. We compared two different types of unsupervised models - the Isolation Forest Model (iForest) and the Gaussian Mixture Model (GMM). The iForest and GMM are both anomaly detection techniques but use different approaches for learning and identifying anomalies. By applying these models separately to each data category’s final output, we attempted to filter Key Opinion Leaders within each data category to assess the performance of both models.
i. iForest:
To effectively discover abnormalities, the iForest model makes use of recursive partitioning and random splitting. Anomaly scores are determined using the average path lengths of those anomalies. ii. GMM:
This is a probabilistic model that assumes a mixture of Gaussian distributions and is used to generate data. For each Gaussian component, it applies the Expectation-Maximization (EM) algorithm to iteratively estimate parameters and assign probabilities to data points.4.3 Machine Learning Models Evaluation:
The two models classified the HCPs into two categories:i. Category A (an anomaly) represents individuals identified as Key Opinion Leaders (KOLs).
ii. Category B (not an anomaly) represents individuals who were not classified as Key Opinion Leaders (KOLs).
The performance of the models is evaluated using ‘F1 score’ and ‘recall’ across various sources. The F1 score provides a balance between precision and recall, while recall focuses on identifying true anomalies. Visualization of F1 scores and Recall distributions (Figure 4) across sources reveals that iForest has a high precision-recall balance.
iForest Advantages:
i. High F1 Scores:
iForest consistently achieved high F1 scores, emphasizing its precision-recall balance. ii. High Recall:
iForest exceeded in identifying anomalies, ensuring a larger proportion of true anomalies are detected. iii. Consistency Across Categories:
iForest has consistently high score across categories demonstrating robustness.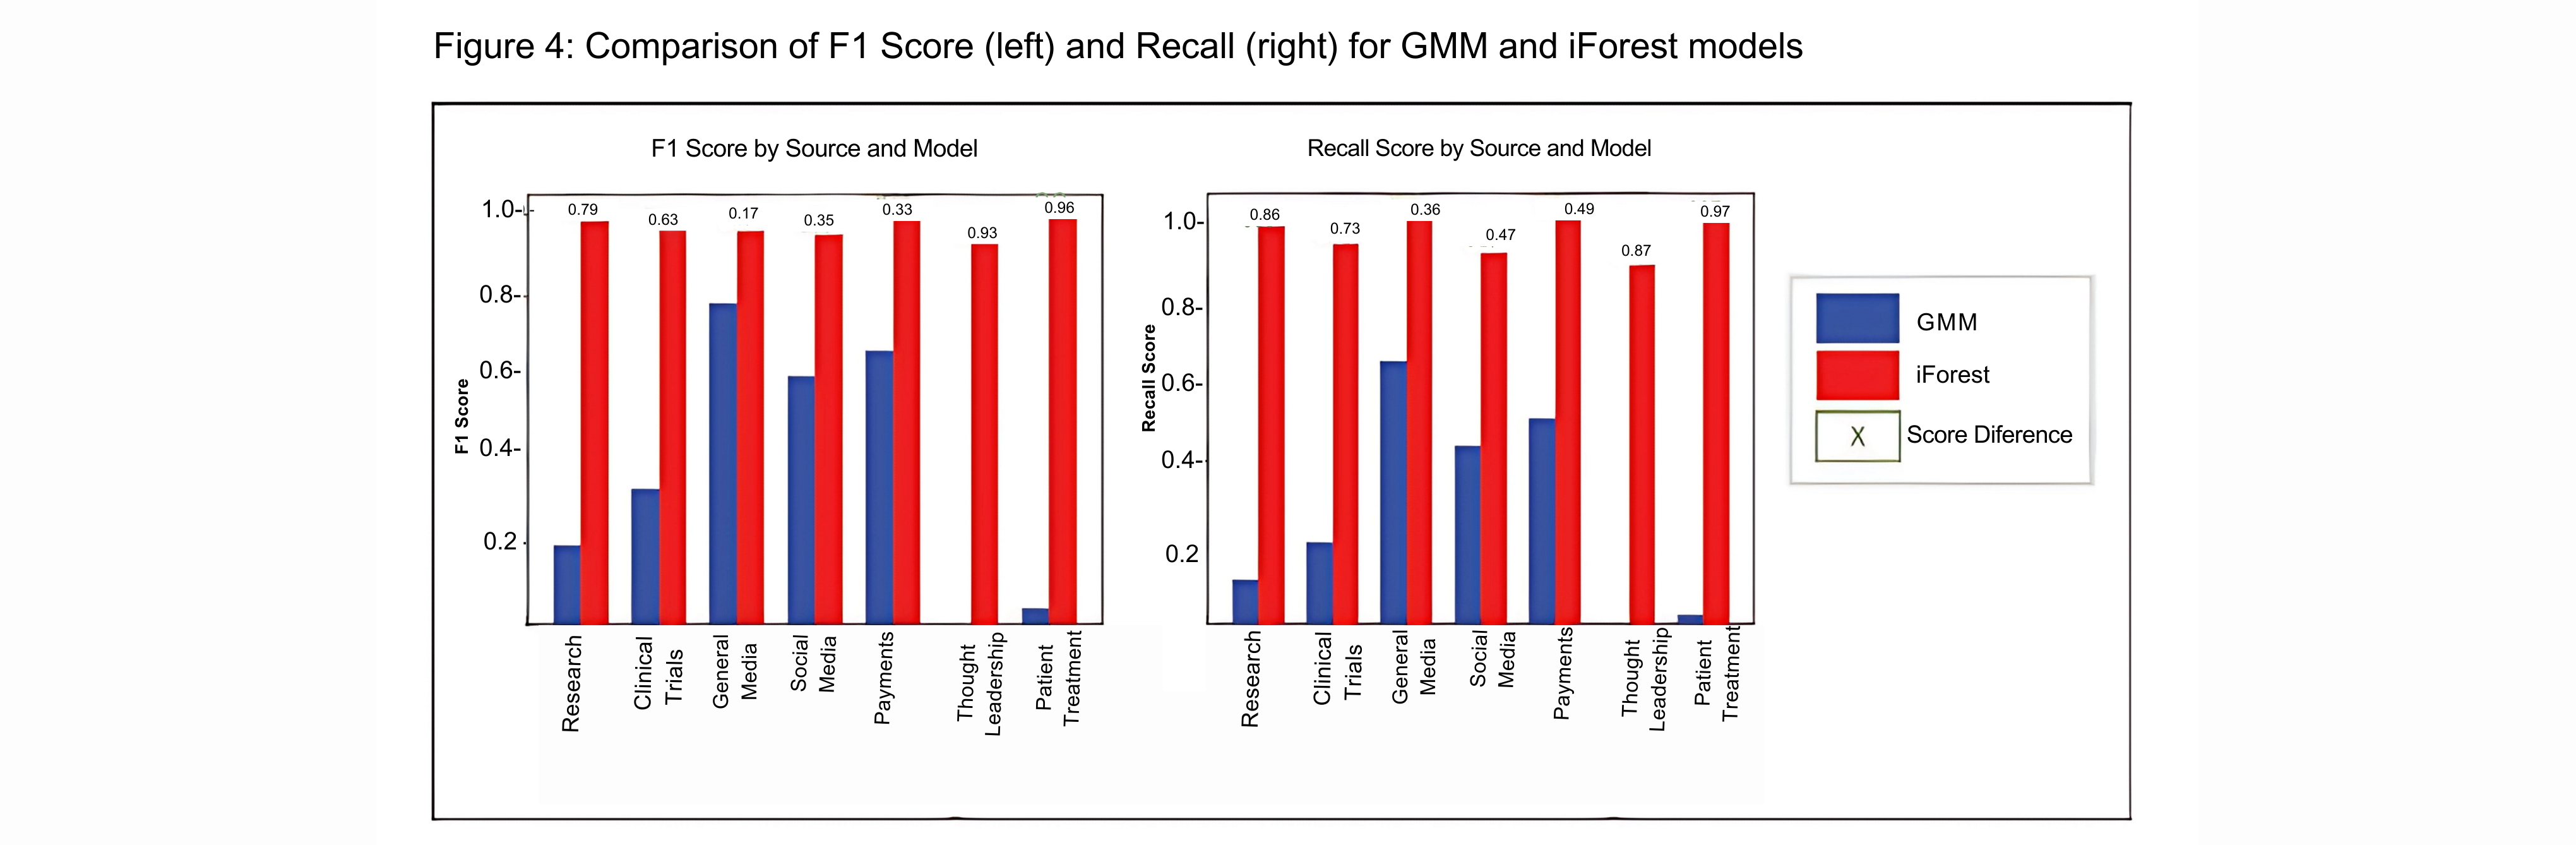
4.4 Machine Learning Model Selection:
Based on the above-observed model performance metrics, we selected and utilized the iForest model for our KOL identification exercise. Its notable qualities, such as a consistently higher recall rate, a well-balanced precision-recall performance, and proven resilience across a variety of data categories, constitute the basis of selection. 4.5 Working of Isolation Forest:
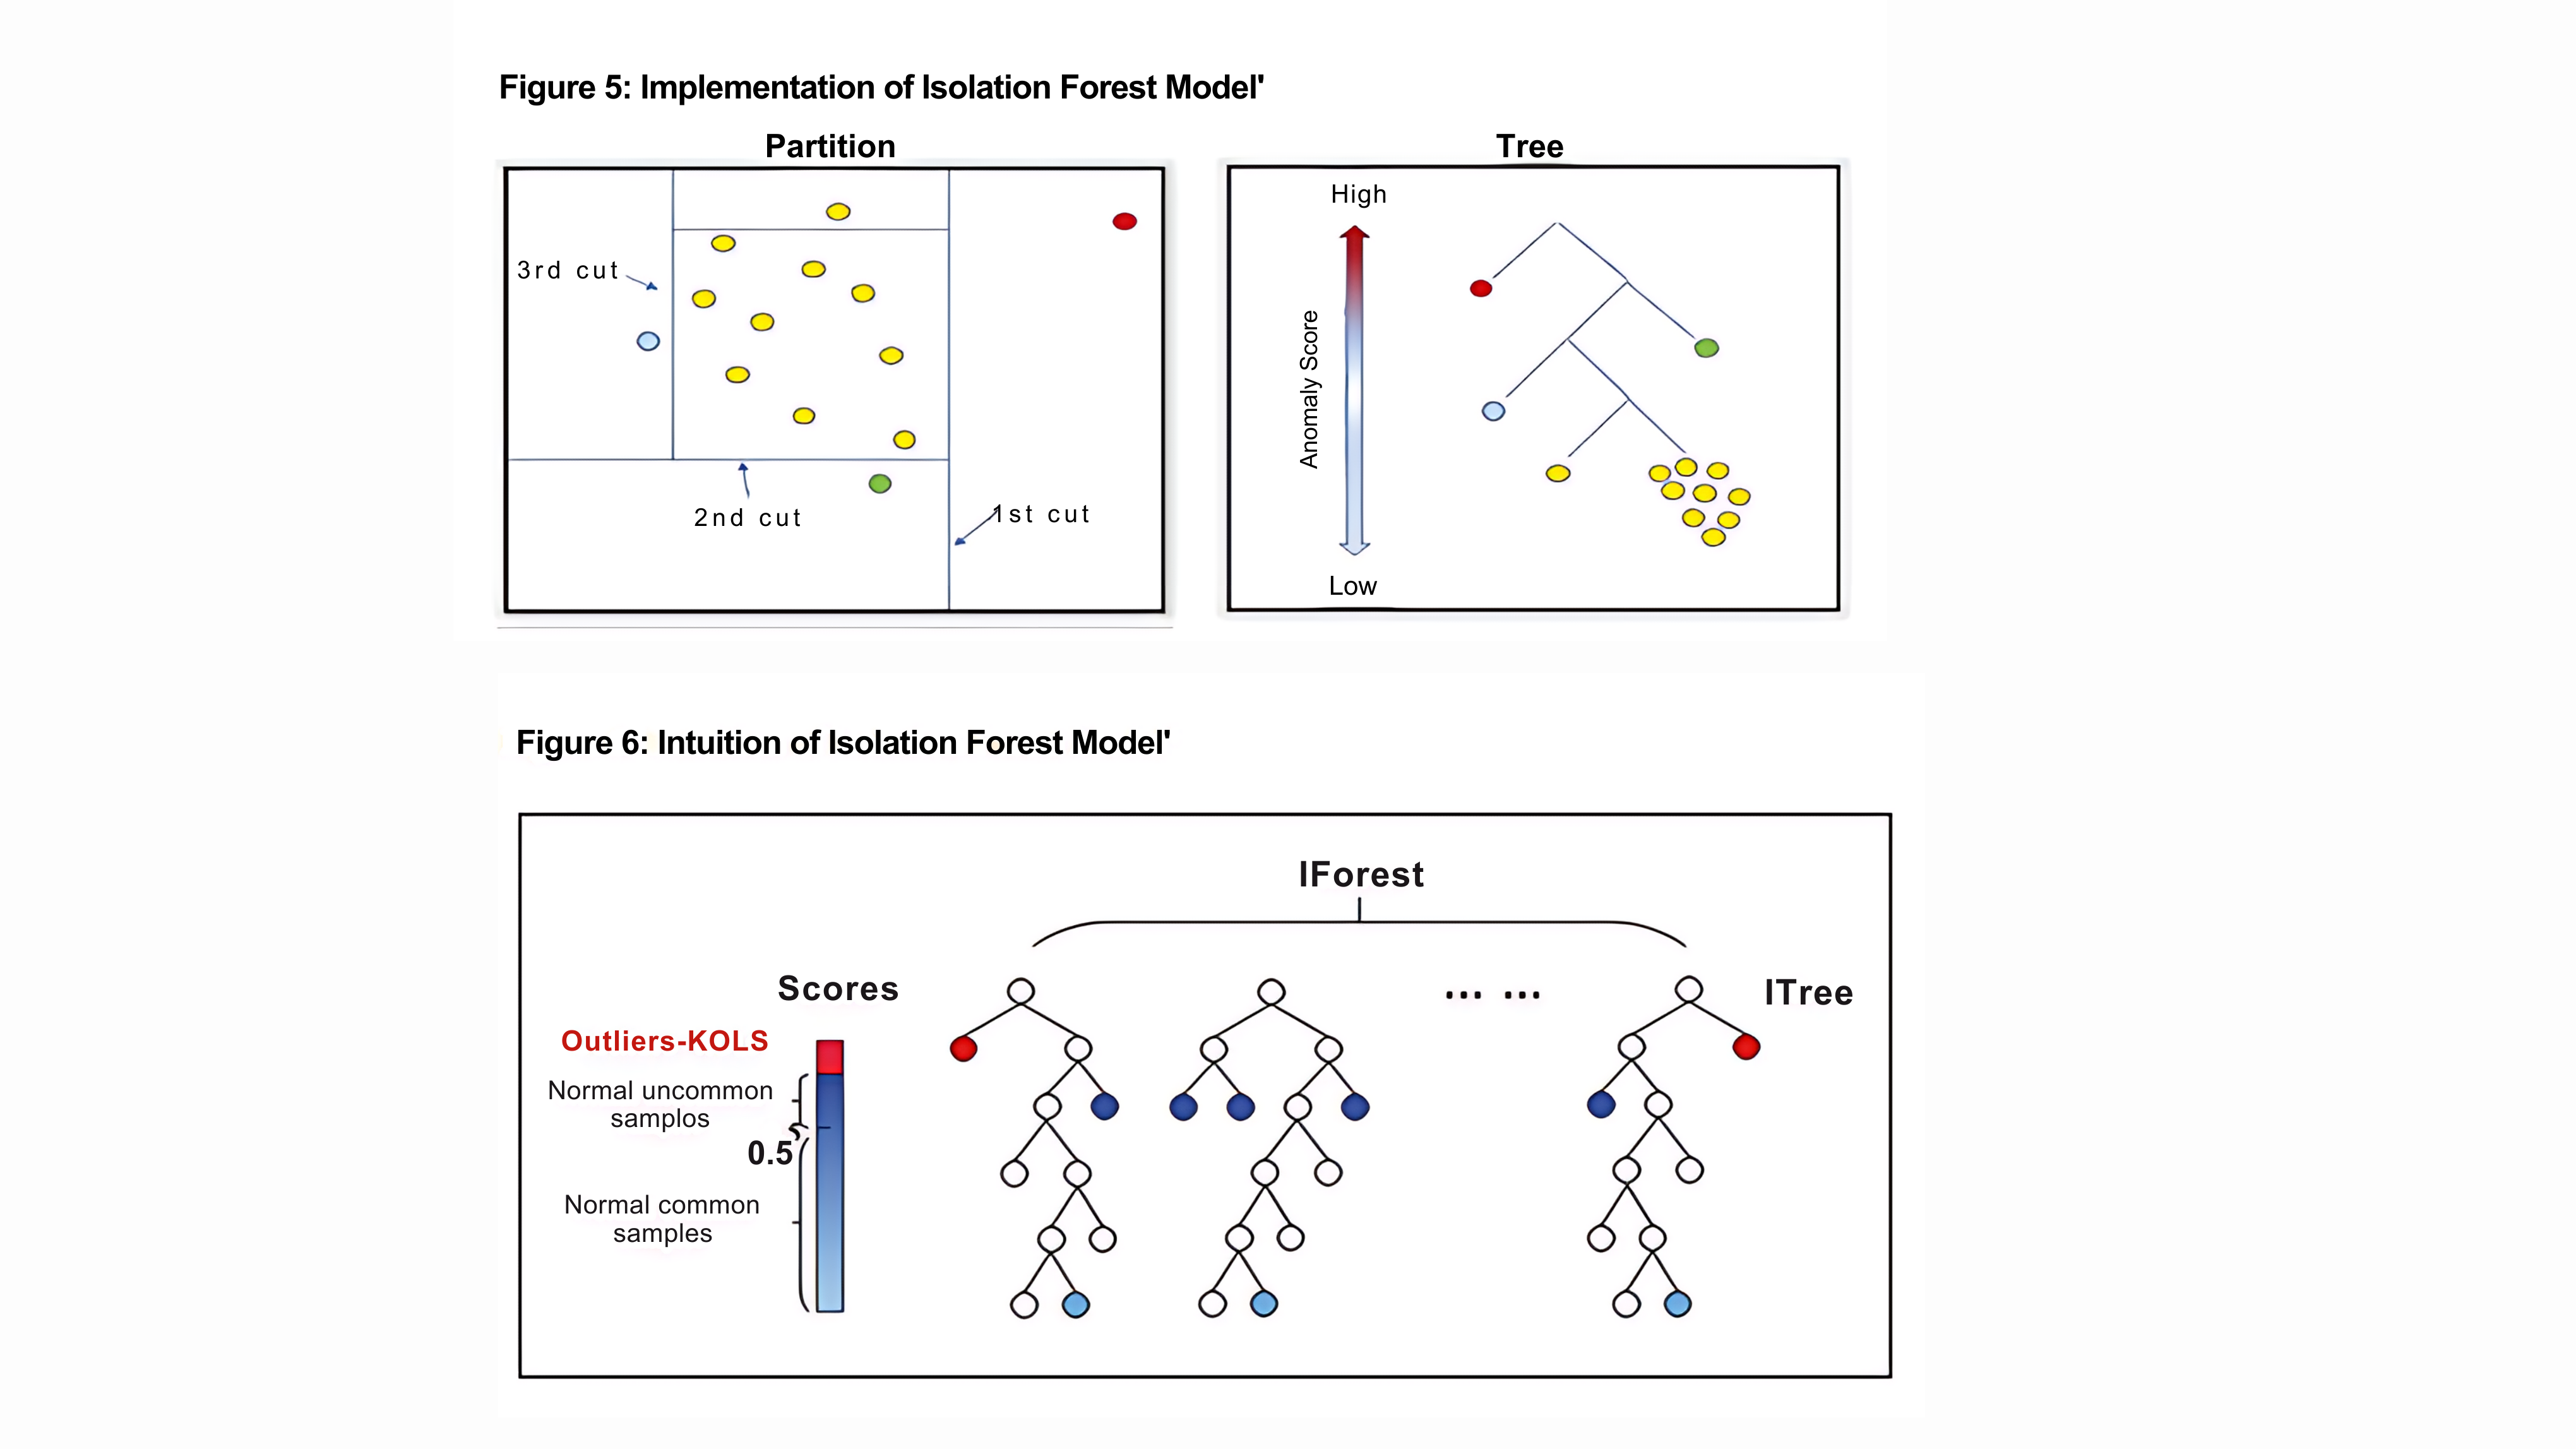
i. Isolation Tree Construction:
Multiple isolation trees are constructed independently. Each tree is built by randomly selecting a subset of features. The recursive partitioning process continues until each data point is isolated in its leaf node. The randomness in feature selection contributes to the diversity of trees. ii. Path Length Calculation:
For each data point, the path length within each isolation tree is computed. The path length is the count of edges (splits) traversed from the root of the tree to the leaf node containing the data point. Anomalies are expected to have shorter paths due to their isolation. iii. Anomaly Score Calculation:
The anomaly score for each data point of each source is determined as the average path length across all isolation trees. Anomalies, being isolated with shorter paths, will have lower average path lengths. Therefore, instances with lower scores are considered more likely to be anomalies.
where: • s(x,n) is the anomaly score for data point x, • E(h(x)) is the average path length for x across all trees, • c(n) is the average path length for an unsuccessful search in a binary tree of n points.
iv. Normalization:
To facilitate better interpretation and comparison of anomaly scores, they are normalized to a standard range, commonly [0, 1].v. Thresholding:
Instances with anomaly scores above the threshold are considered as KOLs, while those below are regarded as non-KOLs.Figures 5 and 6 illustrate the implementation and intuition of the iForest Model respectively.
4.6 Machine Learning Model Score Generation:
Normalized features for each data category were used as inputs in the machine learning models to generate scores for each HCP to identify the Key Opinion Leaders (KOLs). The generated scores also help us to identify the relative importance/ranking of each KOL within each data category. 4.7 Machine Learning Modeling Summary:
For our modeling exercise, we created HCP Activity Features
and HCP Influence Features
across each data category. These category-specific features were then standardized/normalized and ingested in two different machine learning models (iForest and GMM) to derive relative scores for each HCP within each data category. Through comparison of the modeling performance parameters, we also established that iForest proved to be an effective modeling technique for KOL identification and was used to generate scores for each data category (Figure 7)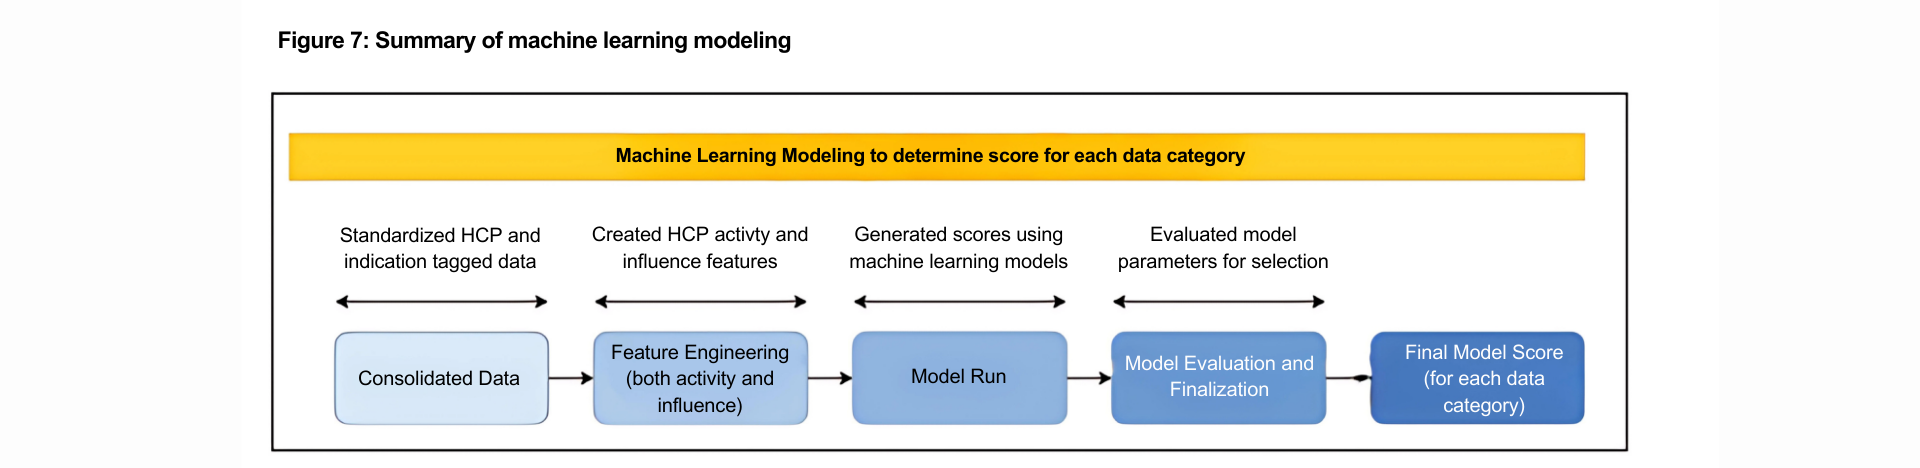
5. Customization as per business objective
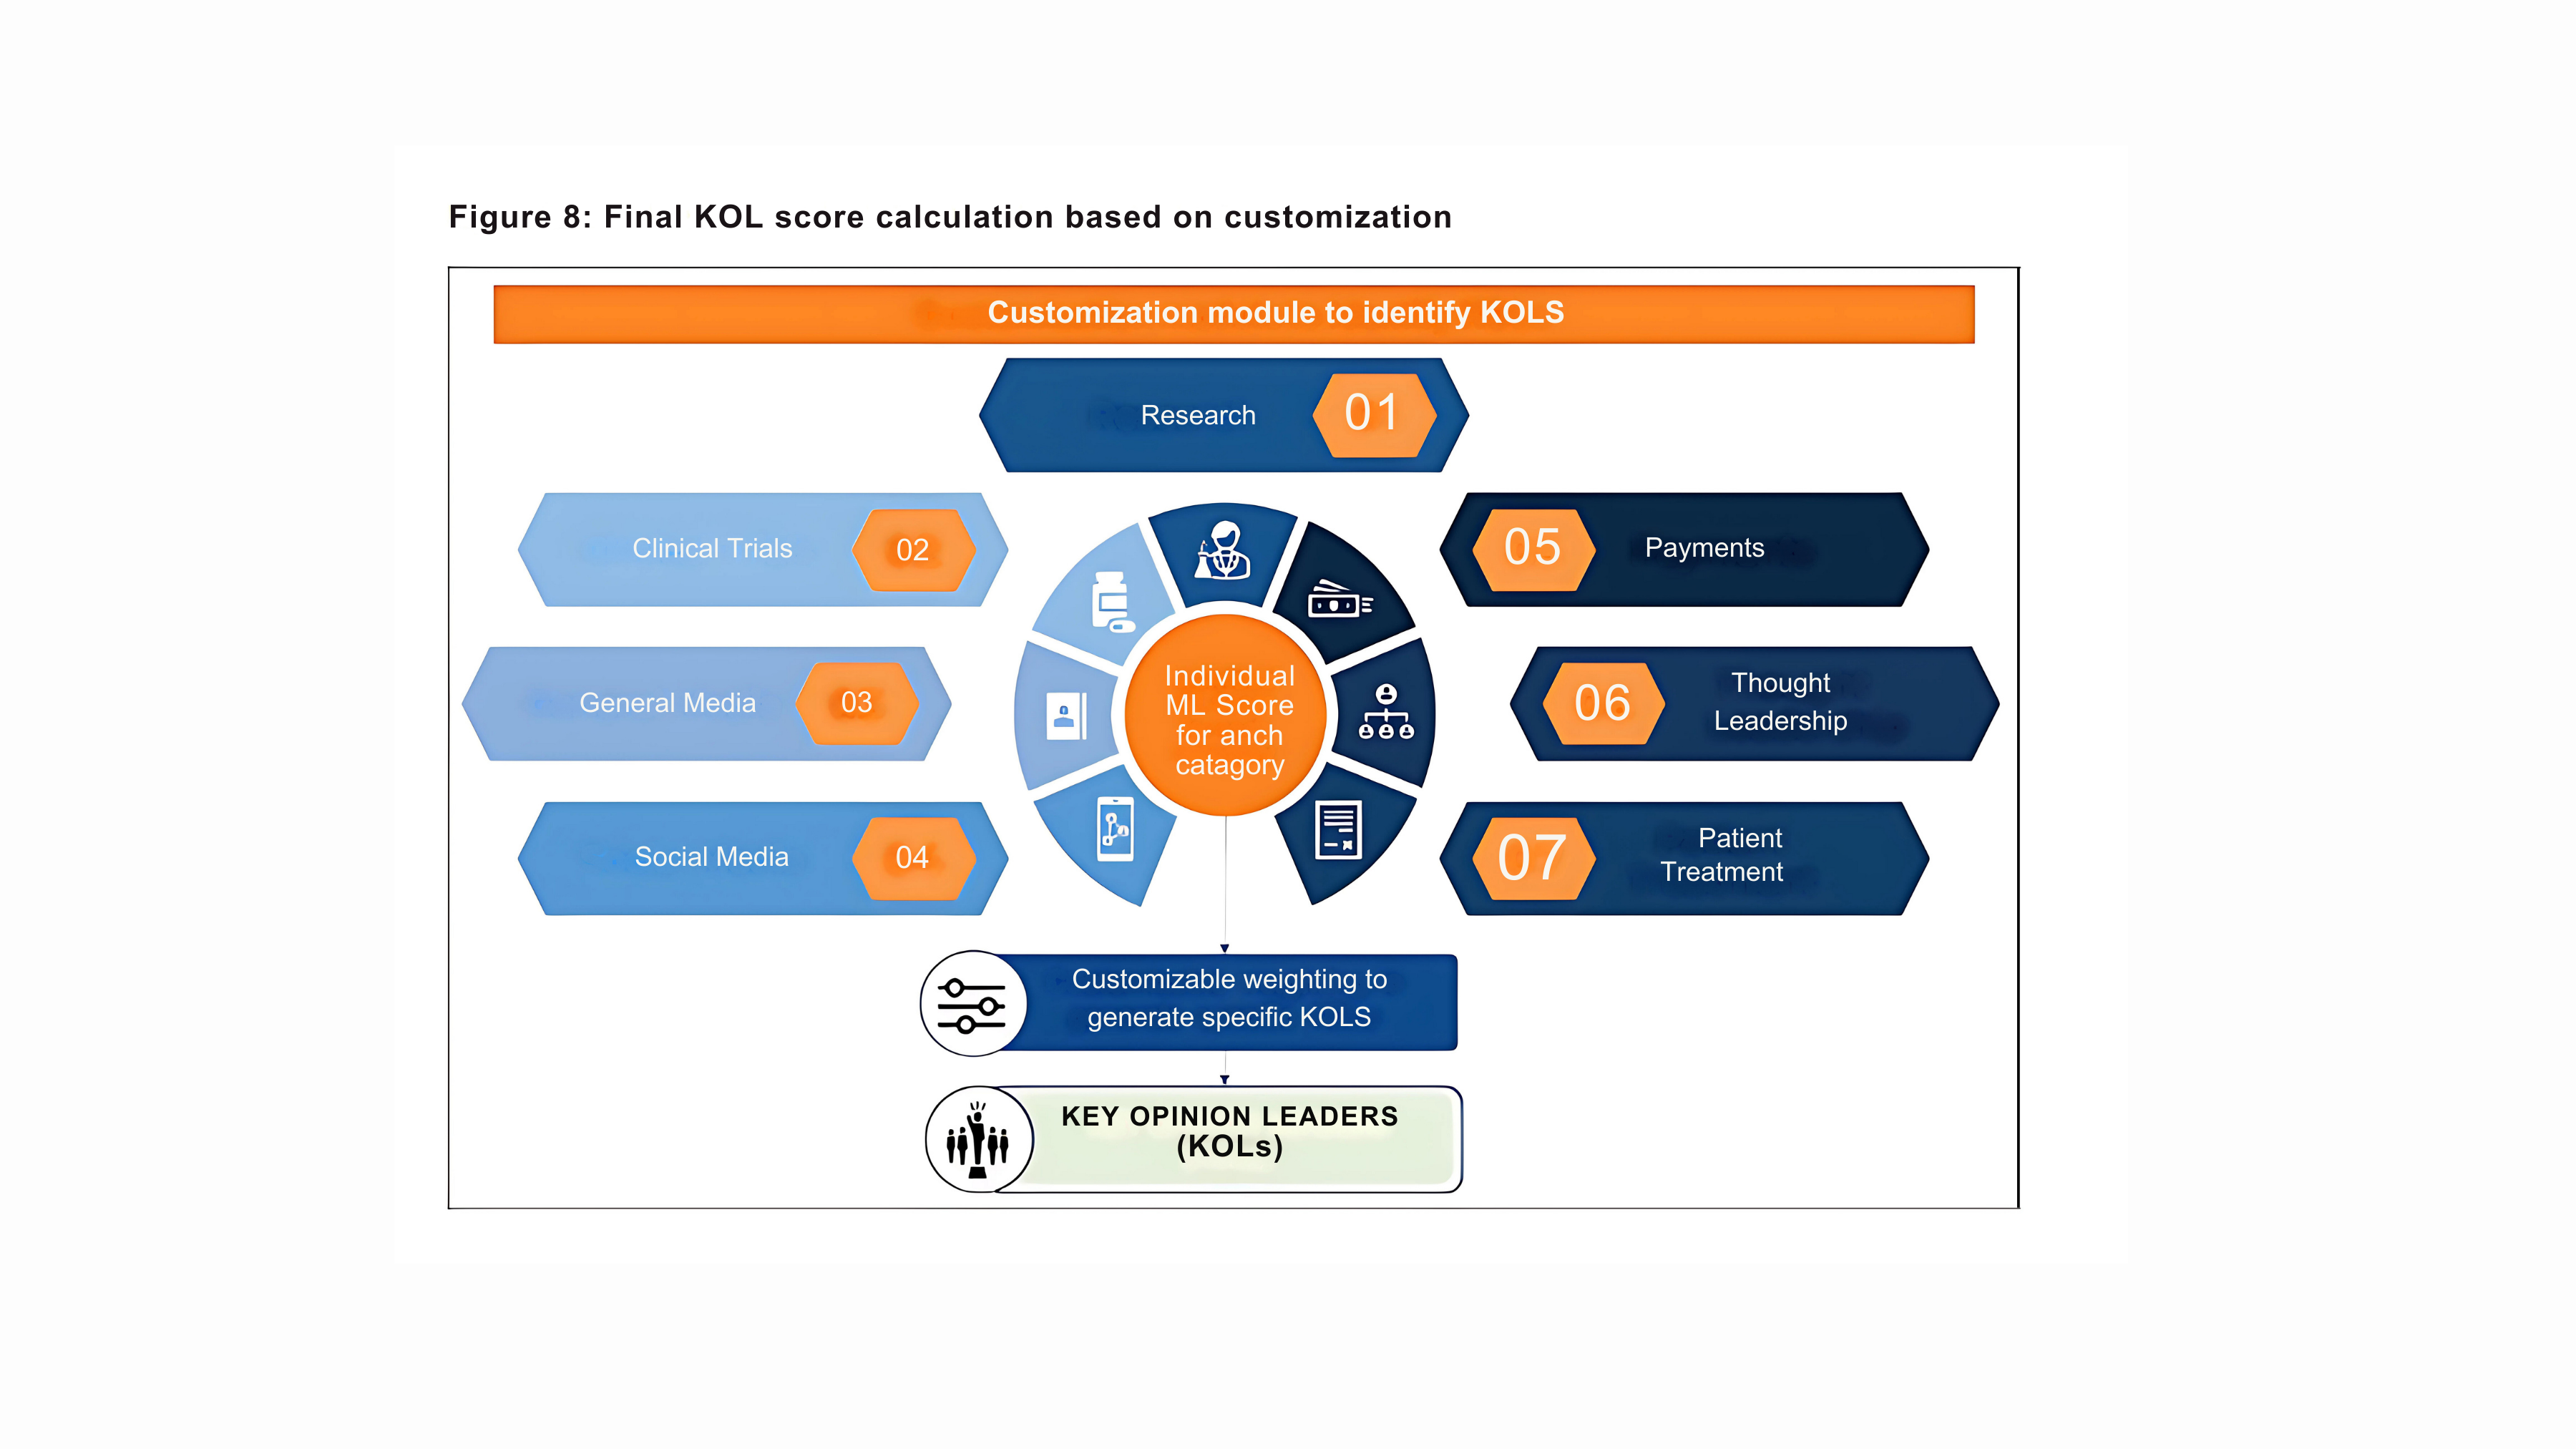
To cater to the evolving business needs, we developed a custom scoring mechanism that provides variable weights to scores of each data category before generating the final score (Figure 8). This customization feature empowers the user to modulate the scores’ importance and generate specific KOLs that are relevant to business requirements. For example, if the business objective is to increase engagement towards digital KOLs, a higher weight could be given to social and general media data categories relative to other data categories to generate a KOL list which is a reflection of Digital Opinion Leaders (DOLs).
6. Conclusion and Future Scope
In this paper, we have presented a detailed methodology to identify KOLs using Real - world datasets and advanced machine-learning techniques. We also talked about an additional customization module that we have developed on top of this to cater to evolving business needs. Our approach could be used to identify KOLs across any geographic and therapeutic area.
The outcomes of our current modeling exercise can be further processed to create additional summaries that can add value to the end user for generating insights. One such domain of interest could be defining the “geographical archetypes” of KOLs. This new metric could potentially quantify the sphere of influence of each KOL within a defined country or geography. Some of the key features that could be considered are – the distance between KOLs and HCPs interacting/connected with them, the number of times they interacted with each other, and the number of sources they have interacted through. Using these features, HCPs could be grouped into three clusters, such as National, Regional, and Local, by using unsupervised machine learning techniques like clustering algorithms.
Read More Articles
Signup for the Newsletter
Connect with Us


@2025 ProcDNA LLC | All Rights Reserved